Portfolio Perspectives
SIDDHESH PHAPALE
GenAI enthusiast dedicated to data analysis, driving diversity impact in Special Projects at SBI Life.
Turning insights into innovation in Diversity and Inclusion.email : [email protected]

AirBnB Listing Analysis
An entry-level Python project for data analysis, exploring Airbnb listings. Clean, visualize, and draw insights from the data, getting a taste of data analysis basics in Python.
Python | Matplotlib

Financial Insights Hub
Presenting the Financial Insights Hub, a meticulously crafted Tableau dashboard offering a comprehensive view of profit and loss statements. Leveraging data from GL, Chart of Accounts, Calendar, Territory, Cash Flow, and more, this dashboard provides a simplified visualization of key financial metrics
Tableau

CaféMetrics: Brewing Excelence
Crafted an insightful Excel dashboard for Café Commerce, leveraging transactional data from the first half of 2023. Achieved key objectives: prepared data for analysis, explored trends with Pivot Tables, and built an interactive dashboard. Unveiling actionable insights and business opportunities for enhanced coffee shop operations.
Microsoft Excel
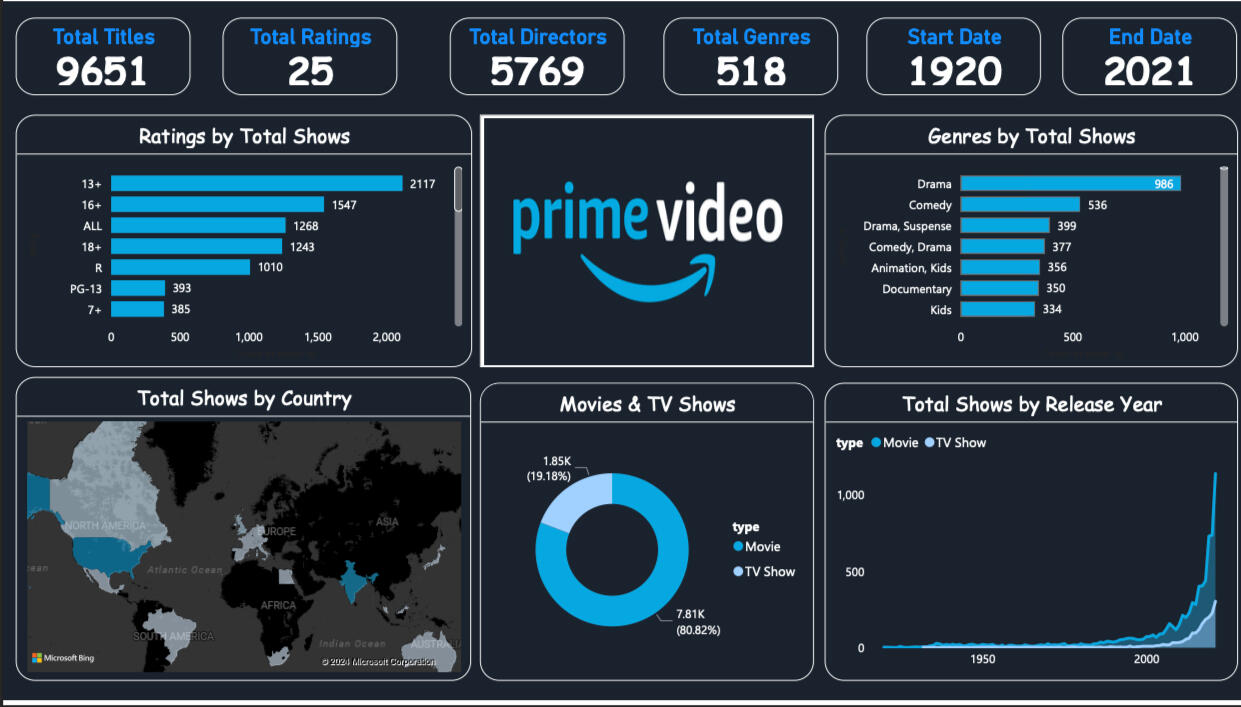
PrimeInsights
Amazon Prime Data Visualisation
PrimeInsights is a PowerBI dashboard that visualizes Amazon Prime's content library. It showcases key metrics such as total shows, unique directors, genre distribution, and ratings. Additionally, it highlights trends in content release and popular genres by country. This project demonstrates my ability to create intuitive and insightful data visualizations in PowerBI.
Power BI

Culinary EDA: Exploring Indian Gastronomy
Dive into the technical intricacies of Exploratory Data Analysis (EDA) with 'UnveilingCulinaryPatterns.' This project employs Python tools to decode the Indian Food dataset, exploring dish popularity, regional nuances, and correlations in cook times. A technical journey through the flavors of Indian cuisine, revealing insights through meticulous data exploration.
Python | Pandas | Data Visualisation